Today it’s not uncommon to turn on the news and hear about yet another business that’s been compromised by a cyberattack. The truth of the matter is that cyberthreats and cyberattacks are on the rise. According to the Federal Bureau of Investigation, there was a 300% increase in reported cybercrimes since the COVID-19 pandemic began.
It’s important that businesses not only understand the security landscape but know just how prevalent cyberattacks occur. This is where a threat map can be a valuable tool for your security strategy.
What is a Threat Map?
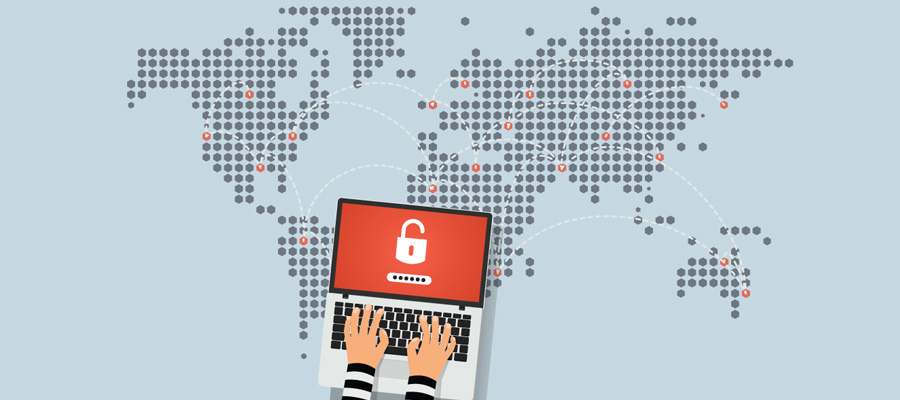
A threat map displays malicious network activity from around the world. The data is shown visually by geographic region and each attack is displayed as a color-coordinated dart of light, reflecting the severity of each attack. With the high frequency that cyberattacks occur, a threat map can look like a scene out of WarGames. Unfortunately, this isn’t a movie – it’s real life – and these are very real attacks happening in countries all over the world.
Understanding the Cyberthreats
A common misconception is that cybercriminals are just attacking Fortune 500 companies, and that’s just simply not the case. Cyberattacks are happening at every level and across every industry from small businesses to local government agencies. In fact, according to research by Accenture, 68% of business leaders felt the risk of a cyberattack increasing.
With cybercriminals not discriminating against who they will attack and why, every business needs to be armed with information about the types of cyberattacks that are taking place and the level of risk that comes with them. Having this knowledge allows you to build a more comprehensive security plan for your organization.
How Does a Threat Map Work?
For many IT professionals, they are well versed on insecurity of the internet. For those not in IT, the realization and depth of attacks that occur every second is easily overlooked and not fully understood. A threat map provides a visualization of real-life cyberattacks happening in real-time and show the level of the severity, location and nature of the attack.
The color of each attack indicates a different level of severity – where green is low, blue is medium, orange is high, and red is critical. By showing severity level based on color, non-IT professionals can quickly look at the map and see the level of risk along with outgoing and incoming attacks by country. To get a more detailed view of geographic location, click on a country to see isolated data of overall activity, incoming attacks, and outgoing attacks.
Watch Cyberattacks as they Happen
Take advantage of TPx’s threat map powered by Fortinet and see cyberattacks take place around the world. If you need to reevaluate your cybersecurity plan, give our security specialists a call and we can give you a free consultation.