When you click on an interface listing anywhere in Network Monitor, you’re taken to a comprehensive series of charts and tools that you can use to understand and proactively manage your network down to a device level.
There is a wealth of detail available in this tool. You’ll find:
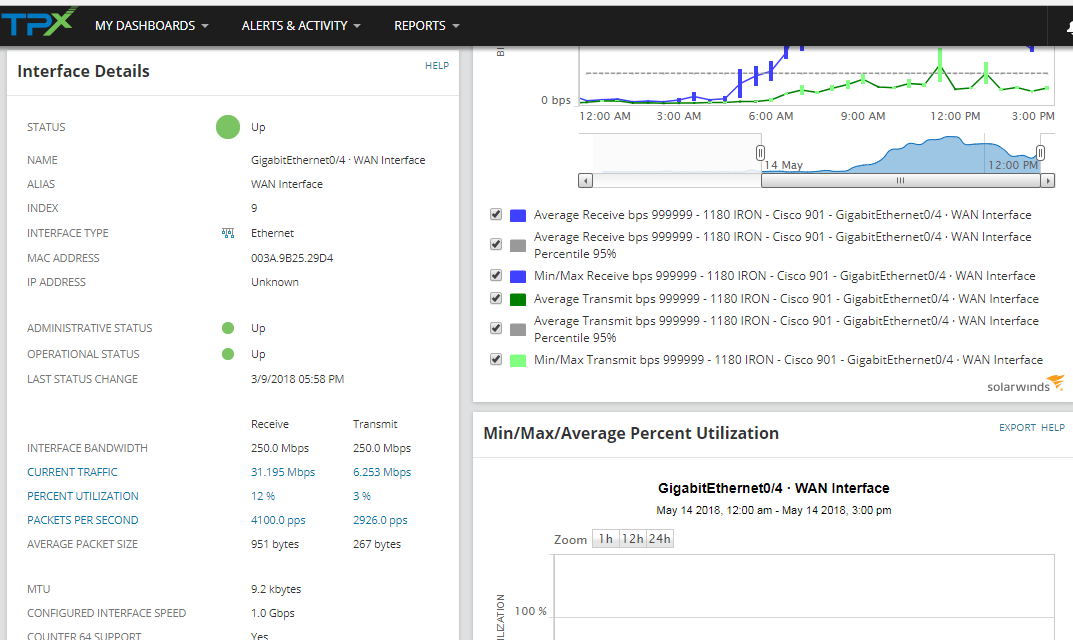
- Interface Details
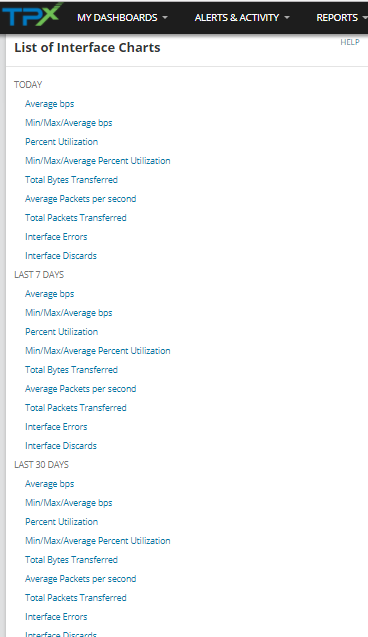
- List of Interface Charts: Drill down to the details by time period.
- Interface Errors & Discards Table
- Maximum Traffic Today: Both receive and transmit, showing both the amount and time of day it occurred.
- Event Summary for this Interface: A log of the current day’s activity.
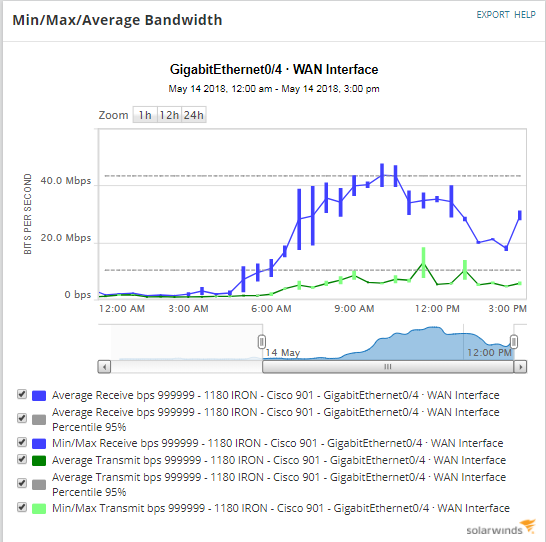
- Min/Max/Average Bandwidth: Charts minimum, maximum and average bits per second transmitted and received over the selected interface over a custom period of time. Hovering your cursor over any point on the timeline calls up specific granular detail about the interface’s performance.
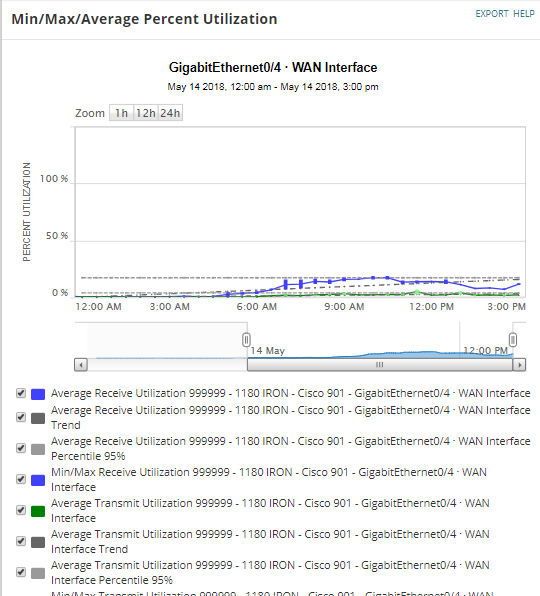
- Percent Utilization: A chart of the selected interface’s receive and transmit utilization, with customizable time frames.
- Errors & Discards
- Total Bytes Transferred: You can customize the chart’s time frame. Hovering your cursor over any point on the timeline calls up detailed information.
- Min/Max/Average Packets: Charts minimum, maximum and average packets per second transmitted and received over the selected interface over a custom period of time. Hovering your cursor over any point on the timeline calls up detailed information.