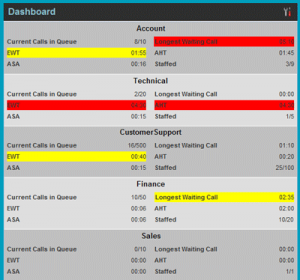
With the Call Center Client, agents can get real-time information about monitored queues. The Dashboard pane lists the monitored call centers and provides key indicators for each.
The following information is provided for each monitored call center:
| Displayed Information | Detail | Notes |
| Call Center Name | The name of the call center. | |
| Service Mode (Premium call centers only) | The mode in which the call center currently operates. This field can have one of the following values:
|
When the call center is in Normal service mode, the Service Mode field displays “None.”Night Service, Night Service Override, and Holiday Service only appear if the policy is triggered (either by a schedule or by a manual override) and if the action to apply to incoming calls is set either to “Perform busy treatment” or “Transfer to phone number/SIP-URI.” Setting the action to “None” acts as if the policy was not triggered. |
| Current Calls in Queue | The number of queued calls expressed as a ratio of the total queue capacity for that call center. For example, “6/10” means that there are six calls in the queue, out of a maximum of ten calls. | |
| Longest Waiting Call | The waiting time of the call that has been in the queue the longest. | |
| EWT | Expected Waiting Time – the estimated time a caller has to wait in this queue before their call is answered. | |
| AHT | Average Handle Time – the average time it takes to process a call in this queue. | |
| ASA | Average Speed of Answer – the average time a caller spends in the queue before the call is offered to an agent. | |
| Staffed | The number of agents that are in Sign-In, Available, Unavailable, or Wrap-Up ACD state, expressed as a ratio of all agents assigned to this call center. |
Select Information to Display
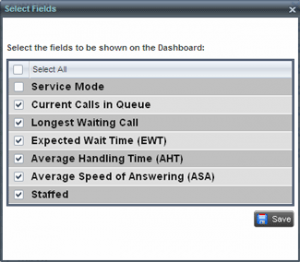
To select which performance indicators you want to display in the Dashboard pane:
- In the Dashboard pane, click Options
 and select the Select Visible Fields The Select Fields dialog box appears.

- To display all performance indicators, check Select All. Alternatively, to show or hide some fields, check or uncheck the corresponding check boxes.
- Click Save.
Threshold Severity
The Current Calls in Queue, Longest Waiting Call, EWT, AHT, and ASA fields are color-coded to provide visual indicators of threshold severity. Threshold values are configured by your administrator.
The visual Indicators of threshold severity are as follows:
| Severity | Color |
| 0 (no threshold crossed) | No color |
| 1 (yellow threshold crossed) | Yellow |
| 2 (red threshold crossed) | Red |
Select Call Centers to Monitor
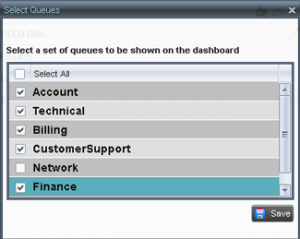
You can select up to 50 call centers to monitor in the Dashboard pane. You can only monitor call centers to which you have been assigned.
To select call centers to monitor:
- In the Dashboard pane, click Options
 and select the Select Queues The Select Queues dialog box appears.

- Check the call centers you want to monitor and click Save.
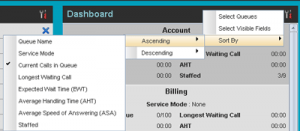
Order Call Centers
By default, call centers displayed in the Dashboard pane are sorted by name. You can change the order in which call centers are displayed:


